Blog Details
Home Blog Details

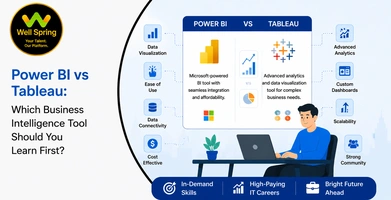
Choosing between Power BI vs Tableau is one of the most common decisions for students, aspiring data analysts, business professionals, and IT graduates entering the world of Business Intelligence (BI). Both tools help organizations transform raw data into meaningful insights through interactive dashboards, reports, and visualizations. However, they differ in pricing, ease of learning, data handling capabilities, enterprise adoption, and career opportunities.
This comprehensive guide compares Power BI vs Tableau, including features, career scope, salaries, industry demand, required skills, certifications, latest 2026 trends, and future growth. Whether you're planning to enroll in a Power BI Course in Trichy or a Tableau Course in Trichy, this guide will help you choose the right Business Intelligence platform for your career.
If you're a beginner looking for an affordable, easy-to-learn Business Intelligence tool with excellent Microsoft integration, Power BI is the ideal choice. If you want advanced data visualization, complex analytics, and enterprise-level dashboard capabilities, Tableau is an excellent option.
Both tools are highly valued in 2026. However, Power BI has gained widespread adoption because of its affordability and seamless integration with Microsoft products, while Tableau continues to lead in advanced visualization and enterprise analytics.
Power BI vs Tableau compares two of the world's leading Business Intelligence tools.
Power BI integrates seamlessly with Microsoft Excel, Azure, SQL Server, and Microsoft 365.
Tableau is renowned for advanced data visualization and analytical flexibility.
Both tools are in high demand across multiple industries.
Business Intelligence professionals play a critical role in data-driven decision-making.
Practical dashboard projects significantly improve employability.
Data visualization skills are becoming essential for business analysts and data professionals.
AI-powered analytics are transforming Business Intelligence platforms.
Organizations today generate enormous amounts of data from websites, mobile applications, ERP systems, customer transactions, IoT devices, social media platforms, and cloud applications. However, raw data alone has little value unless it can be transformed into meaningful insights that support business decisions.
This is where Business Intelligence (BI) tools like Power BI and Tableau become essential.
Businesses rely on these platforms to analyze sales performance, customer behavior, financial trends, operational efficiency, inventory management, and market performance through interactive dashboards and visual reports.
According to Fortune Business Insights, the global Business Intelligence market was valued at over USD 29 billion in 2024 and is projected to surpass USD 63 billion by 2032, growing at a strong CAGR as organizations increasingly adopt data-driven decision-making.
Similarly, the U.S. Bureau of Labor Statistics projects employment for Data Scientists to grow by 36% between 2023 and 2033, while demand for Business Intelligence Analysts and Data Analysts continues to increase as organizations prioritize analytics and reporting capabilities.
This rapid growth has made Power BI vs Tableau one of the most searched technology comparisons among aspiring data professionals.
Many learners ask:
The answer depends on your career goals, analytical interests, and the industries you want to work in.
If you enjoy working within the Microsoft ecosystem and creating interactive dashboards quickly, Power BI may be the ideal platform.
If you're passionate about advanced analytics, enterprise reporting, and highly customizable visualizations, Tableau could be the better choice.
At Well Spring Talent Solutions, students receive practical training through live dashboard projects, case studies, portfolio development, expert mentorship, interview preparation, and placement assistance. Whether enrolling in a Power BI Course in Trichy or a Tableau Course in Trichy, learners gain real-world experience aligned with modern Business Intelligence requirements.
Every business today depends on data to make informed decisions. Organizations no longer rely solely on intuition—they use dashboards, reports, predictive analytics, and KPIs to monitor performance and improve operations.
Industries actively hiring Business Intelligence professionals include:
Business Intelligence professionals help organizations:
As businesses continue investing in analytics and digital transformation, Business Intelligence professionals remain in high demand.
One of the biggest misconceptions among beginners is believing that completing a Business Intelligence certification alone guarantees a job.
In reality, employers evaluate practical analytical skills.
Recruiters typically assess:
Dashboard development
Data visualization
SQL knowledge
Excel proficiency
Data modeling
Business understanding
Problem-solving ability
Communication skills
Portfolio quality
Candidates who build dashboards using real-world business datasets often stand out over those with only theoretical certifications.
This is why live projects and portfolio development are essential for launching a successful Business Intelligence career.
Power BI is Microsoft's Business Intelligence platform designed to transform raw business data into interactive dashboards, reports, and visual insights.
It enables organizations to connect multiple data sources, clean data, build data models, create visual reports, and share business intelligence across teams.
Power BI is particularly popular because of its seamless integration with Microsoft technologies, including:
Microsoft Excel
SQL Server
Azure
Microsoft Dynamics 365
SharePoint
Microsoft Fabric
Microsoft 365
Power BI supports organizations in making faster, data-driven decisions through real-time reporting and interactive dashboards.
A professional Power BI Course in Trichy equips students with practical Business Intelligence skills required by modern organizations.
Students typically learn:
Data Analytics Fundamentals
Microsoft Power BI Desktop
Data Import
Power Query
Data Cleaning
Data Modeling
DAX (Data Analysis Expressions)
Dashboard Design
Interactive Reports
KPI Development
Power BI Service
Data Visualization Best Practices
Excel Integration
SQL Integration
Report Publishing
Business Analytics
Students also build multiple live dashboards that strengthen their professional portfolios.
Power BI professionals are employed across organizations that rely on business analytics and reporting.
Common employers include:
IT Companies
Banking & Financial Institutions
Manufacturing Companies
Healthcare Organizations
Retail Businesses
E-commerce Companies
Consulting Firms
Government Organizations
Logistics Companies
Insurance Providers
Educational Institutions
SaaS Companies
Telecom Companies
Digital Marketing Agencies
Power BI's affordability and Microsoft ecosystem integration make it one of the most widely adopted Business Intelligence platforms worldwide.
Organizations increasingly rely on Power BI because it enables decision-makers to visualize complex business data quickly and efficiently.
Businesses use Power BI to:
Track business performance
Analyze customer trends
Monitor financial KPIs
Improve operational efficiency
Forecast sales
Evaluate marketing campaigns
Support executive decision-making
Automate reporting
As more businesses embrace data-driven strategies, Power BI professionals continue to enjoy excellent career opportunities across industries.
Tableau is a leading Business Intelligence and data visualization platform designed to help organizations analyze, visualize, and understand complex data through interactive dashboards and reports. Acquired by Salesforce in 2019, Tableau has become one of the most widely used analytics platforms for enterprises, data analysts, business consultants, and research professionals.
Unlike traditional reporting tools, Tableau allows users to connect multiple data sources, explore datasets visually, create advanced dashboards, and uncover hidden business trends with minimal coding.
Tableau is particularly recognized for its powerful drag-and-drop interface, advanced visualization capabilities, and ability to process large datasets efficiently.
Popular Tableau applications include:
Large enterprises across industries rely on Tableau to transform complex datasets into actionable business insights.
A professional Tableau Course in Trichy equips students with practical visualization and analytics skills required by modern organizations.
Students typically learn:
Students also build real-world dashboards using business datasets from sales, finance, healthcare, retail, and marketing industries.
Tableau professionals are highly valued in organizations that depend on advanced business analytics and executive reporting.
Common employers include:
Tableau's advanced visualization capabilities make it a preferred choice for organizations handling large-scale analytical projects.
Organizations increasingly use Tableau because executives need fast, interactive, and visually rich reports to support strategic decision-making.
Businesses rely on Tableau to:
Visualize business performance
Analyze customer trends
Monitor operational efficiency
Identify growth opportunities
Improve financial reporting
Track marketing performance
Forecast future demand
Support executive decision-making
Its flexibility and analytical capabilities continue to make Tableau one of the most respected Business Intelligence platforms worldwide.
Although both platforms help organizations transform data into actionable insights, they differ in usability, pricing, visualization capabilities, and enterprise adoption.
|
Feature |
Power BI |
Tableau |
|
Developed By |
Microsoft |
Salesforce |
|
Ease of Learning |
Beginner-Friendly |
Moderate |
|
Best For |
Business reporting & Microsoft ecosystem |
Advanced analytics & visualization |
|
Data Visualization |
Excellent |
Outstanding |
|
Excel Integration |
Native |
Available |
|
AI Features |
Microsoft Copilot Integration |
Tableau Pulse & Einstein AI |
|
Pricing |
More affordable |
Premium pricing |
|
Enterprise Adoption |
Very High |
Very High |
|
Large Dataset Handling |
Excellent |
Excellent |
|
Community Support |
Extensive |
Extensive |
Both tools are industry leaders, and the best choice depends on your career goals and organizational requirements.
One of the most common questions students ask is about Power BI vs Tableau for Data Analytics.
Power BI is ideal for:
Tableau is ideal for:
For beginners entering Business Intelligence, Power BI is often easier to learn. Tableau is particularly valuable for professionals working in data-heavy enterprise environments.
Business Intelligence professionals frequently compare Power BI and Tableau based on practical business requirements.
Choose Power BI if you enjoy:
Microsoft Excel
Business Dashboards
KPI Reporting
Financial Analytics
Affordable Solutions
Microsoft Ecosystem
Easy Learning Curve
Business Reporting
Choose Tableau if you enjoy:
Advanced Visualization
Data Storytelling
Enterprise Analytics
Interactive Dashboards
Complex Data Analysis
Research Analytics
Executive Reporting
Advanced Business Insights
Learning both platforms provides excellent career flexibility in today's competitive analytics industry.
Many students ask Which is Better Power BI or Tableau?
There is no single answer because each platform excels in different scenarios.
Choose Power BI if you prefer:
Choose Tableau if you prefer:
Professionals who understand both tools are highly sought after because many organizations use multiple Business Intelligence platforms.
Business Intelligence professionals continue to enjoy strong salary growth worldwide.
|
Job Role |
Salary Growth Potential |
|
Power BI Developer |
High |
|
Tableau Developer |
High |
|
Business Intelligence Analyst |
Very High |
|
Data Analyst |
Very High |
|
BI Consultant |
Excellent |
|
Analytics Manager |
Excellent |
|
Data Visualization Specialist |
Very High |
Salary depends on:
Technical Skills
Portfolio
Business Understanding
Experience
Industry
Dashboard Complexity
Professionals with expertise in both Power BI and Tableau often command higher salaries because they can adapt to different organizational environments.
Successful Power BI professionals typically master:
Microsoft Excel
Power BI Desktop
Power Query
DAX
SQL
Data Modeling
Dashboard Development
Business Analytics
Microsoft Fabric
Azure Integration
Data Cleaning
Report Publishing
KPI Design
Business Reporting
Professional Tableau developers generally master:
Tableau Desktop
Tableau Server
Data Visualization
SQL
Calculated Fields
LOD Expressions
Dashboard Actions
Data Blending
Storytelling
Business Analytics
Data Interpretation
Interactive Reporting
Business Intelligence
Business Intelligence is about solving business problems, not just creating attractive dashboards.
Understand business processes before building reports.
SQL remains one of the most valuable skills for Business Intelligence professionals because most organizational data resides in databases.
A dashboard should answer business questions rather than simply display charts.
Always focus on actionable insights.
Employers value candidates who have created dashboards using realistic datasets.
Projects may include:
Visualization alone isn't enough.
Professionals should learn to communicate insights clearly to business stakeholders.
Business Intelligence continues evolving rapidly.
Key trends include:
AI-powered Business Intelligence
Self-service Analytics
Microsoft Fabric Adoption
Tableau Pulse
Predictive Analytics
Real-time Dashboards
Embedded Analytics
Cloud-based BI
Data Governance
Natural Language Queries
Augmented Analytics
Data Democratization
Automated Reporting
Executive Decision Intelligence
Professionals who combine Business Intelligence with AI, SQL, and cloud analytics will remain highly competitive.
Students looking for an industry-oriented Power BI Course in Trichy or Tableau Course in Trichy receive practical training aligned with current Business Intelligence industry requirements.
Training includes:
Microsoft Power BI
Tableau Desktop
SQL
Excel for Analytics
Data Visualization
Dashboard Development
DAX
Business Analytics
Live Industry Projects
Portfolio Development
Internship Opportunities
Resume Building
Mock Interviews
Placement Assistance
Expert Mentorship
Students graduate with practical dashboard development experience that prepares them for modern Business Intelligence roles.
1. Master Excel and SQL First
A strong foundation in Excel and SQL makes learning Power BI and Tableau much easier.
2. Focus on Business Problems
Successful BI professionals solve business challenges rather than simply creating reports.
3. Build a Portfolio
Develop dashboards for sales, finance, HR, and marketing to demonstrate your practical skills.
4. Learn Data Storytelling
Communicating insights effectively is just as important as creating visualizations.
5. Stay Updated
Business Intelligence platforms evolve rapidly. Keep learning AI-powered analytics, cloud BI, and new visualization techniques.
Which is better: Power BI or Tableau?
Both are excellent Business Intelligence platforms. Power BI is ideal for beginners and Microsoft-based organizations, while Tableau excels in advanced visualization and enterprise analytics.
Is Power BI easier than Tableau?
Yes. Power BI generally has a shorter learning curve because of its familiar Microsoft interface and seamless Excel integration.
Can I learn both Power BI and Tableau?
Yes. Many Business Intelligence professionals learn both tools to increase their career opportunities and adapt to different business environments.
Is Business Intelligence a good career in 2026?
Yes. Organizations across industries are investing heavily in analytics, making Business Intelligence one of the fastest-growing technology careers.
Do I need programming to learn Power BI or Tableau?
Basic SQL knowledge is highly recommended. While programming is not mandatory for beginners, understanding SQL, DAX, and data modeling significantly improves career opportunities.
The demand for Business Intelligence professionals continues to grow across Trichy, Madurai, Thanjavur, Karur, Dindigul, Pudukkottai, Ariyalur, Perambalur, and other regions of Tamil Nadu. Organizations across banking, healthcare, retail, manufacturing, IT services, and consulting are actively recruiting professionals with expertise in Power BI, Tableau, SQL, and data visualization.
At Well Spring Talent Solutions, students receive practical, industry-oriented training through a Power BI Course in Trichy and Tableau Course in Trichy, featuring live dashboard projects, expert mentorship, internships, portfolio development, interview preparation, and placement assistance.
What is the difference between Power BI and Tableau?
Power BI is Microsoft's Business Intelligence platform known for affordability and Microsoft integration, while Tableau specializes in advanced data visualization, interactive analytics, and enterprise reporting.
Which Business Intelligence tool has better job opportunities?
Both Power BI and Tableau offer excellent career opportunities. Power BI is widely adopted by organizations using Microsoft technologies, while Tableau remains highly valued for enterprise analytics and consulting projects.
Which tool should beginners learn first?
Power BI is generally recommended for beginners because of its intuitive interface, lower cost, and seamless integration with Excel and other Microsoft products.
Is Tableau better than Power BI for data analytics?
Tableau offers advanced visualization and analytical flexibility, making it ideal for complex analytics projects. Power BI is better suited for business reporting, operational dashboards, and organizations within the Microsoft ecosystem.
Is Business Intelligence worth learning in 2026?
Yes. As organizations increasingly rely on data-driven decision-making, Business Intelligence remains one of the fastest-growing and most rewarding career paths in analytics and technology.
Power BI vs Tableau compares two of the world's leading Business Intelligence platforms.
Power BI is beginner-friendly, affordable, and integrates seamlessly with Microsoft products.
Tableau excels in advanced data visualization and enterprise analytics.
SQL, data modeling, and dashboard development are essential skills for both platforms.
Practical dashboard projects and business problem-solving skills significantly improve employability.
Professionals proficient in both Power BI and Tableau enjoy broader career opportunities and higher long-term growth.
Choosing between Power BI vs Tableau depends on your career aspirations, technical interests, and the type of organizations you want to work with. If you're looking for an easy-to-learn, cost-effective Business Intelligence platform with excellent Microsoft integration, Power BI is an outstanding choice. If you're passionate about advanced data visualization, storytelling, and enterprise analytics, Tableau offers exceptional opportunities.
At Well Spring Talent Solutions, students receive practical training through live dashboard projects, portfolio development, expert mentorship, internship opportunities, interview preparation, and placement assistance. Whether you choose a Power BI Course in Trichy or a Tableau Course in Trichy, you'll gain the practical skills needed to build a successful career in Business Intelligence and data analytics.
Start your Business Intelligence journey today and become a data-driven professional ready to support smarter business decisions.
21 Oct 2026
21 Oct 2026

20 Oct 2026
20 Oct 2026

19 Oct 2026
Both tools offer strong career opportunities. Power BI has broader adoption among Microsoft-based organizations and small-to-medium businesses, while Tableau is widely used in enterprise analytics, consulting, and research-driven industries.
Yes. Learning both platforms is highly beneficial because many organizations use multiple Business Intelligence tools. Professionals with expertise in Power BI and Tableau have greater flexibility in the job market.
Yes. SQL is one of the most important skills for Business Intelligence professionals because it enables efficient data extraction, transformation, and analysis from relational databases.
Yes. Employers often prioritize candidates who can demonstrate practical dashboard development, business analytics projects, and real-world problem-solving abilities. Certifications strengthen your profile, but practical experience creates a stronger impression.
Begin by learning Excel, SQL, and data analytics fundamentals. Then master Power BI or Tableau, work on real-world dashboard projects, build a professional portfolio, stay updated with AI-powered analytics trends, and enroll in an industry-oriented training program that offers live projects, mentorship, internships, and placement assistance.
We provide IT training, internships, and online learning for students in Trichy and across India.
We also welcome enquiries from students in these neighbourhoods, towns, and surrounding locations.
Can't attend classes in person? Explore online IT training opportunities with Well Spring Talent Solutions, designed to help learners develop practical technology skills from different locations across India.
Get internship updates, IT training news, placement opportunities, and career tips directly to your inbox.
Join our WhatsApp community for internship updates, IT courses, placement support, and latest job opportunities.
Join Now