Blog Details
Home Blog Details

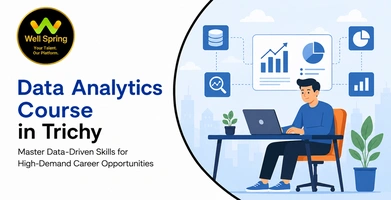
Microsoft Excel remains one of the most widely used tools for business reporting, financial analysis, and data-driven decision-making. Whether you are a student, job seeker, business professional, or entrepreneur, enrolling in an Excel for Data Analytics Course helps you master advanced spreadsheet techniques, data visualization, dashboards, formulas, PivotTables, and business reporting. This guide explains how Excel supports modern data analytics, the skills you will learn, career opportunities, certifications, and how practical training can help you become a confident data professional.
An Excel for Data Analytics Course teaches learners how to organize, clean, analyze, visualize, and interpret business data using Microsoft Excel. The course covers advanced formulas, PivotTables, dashboards, charts, Power Query, lookup functions, and business reporting. It is suitable for students, professionals, accountants, business analysts, and anyone who wants to make data-driven decisions using Excel.
Excel remains one of the most widely used business analysis tools.
Advanced Excel skills improve productivity and decision-making.
Practical dashboards and reports enhance employability.
Excel integrates well with Power BI and other analytics tools.
Business analytics begins with strong Excel fundamentals.
Advanced Excel is valuable across almost every industry.
In today's digital economy, organizations rely on data to make smarter business decisions. However, collecting data alone is not enough. Businesses need professionals who can organize, analyze, and present information in a meaningful way. This is where Microsoft Excel continues to play a vital role.
According to Microsoft's Work Trend Index 2024, Excel remains one of the most widely used productivity applications globally, supporting millions of professionals in finance, operations, sales, human resources, and business reporting. Its versatility and powerful analytical capabilities make it one of the most valuable workplace skills for aspiring data professionals.
An Excel for Data Analytics Course helps learners build practical skills that are useful across industries. Whether you are preparing for your first job, planning a career in business analytics, or looking to improve workplace productivity, mastering Excel creates a strong foundation for data-driven decision-making.
At Well Spring Talent Solutions, learners gain practical knowledge through hands-on exercises, business case studies, live projects, and expert guidance that prepares them for real workplace challenges.
An Excel for Data Analytics Course is a professional training program that teaches learners how to analyze business data, generate reports, build dashboards, and support business decisions using Microsoft Excel.
A comprehensive Advanced Excel Course generally includes:
Excel Fundamentals
Advanced Formulas and Functions
Lookup Functions (VLOOKUP, XLOOKUP, INDEX-MATCH)
PivotTables and Pivot Charts
Conditional Formatting
Data Validation
Data Cleaning Techniques
Power Query
Dashboard Development
Business Reporting
Basic Data Visualization
Excel Automation Basics
These topics help learners confidently work with business datasets and generate actionable insights.
Excel is often the first analytics tool used by businesses because it combines data management, reporting, visualization, and analysis in one platform. Professionals use Excel to identify trends, forecast sales, prepare financial reports, analyze customer behavior, and monitor business performance.
Excel remains one of the most requested technical skills across industries.
Students benefit because Excel helps them:
Fresh graduates gain an advantage because employers often expect candidates to have strong spreadsheet and reporting skills.
Working professionals use Excel to improve efficiency in finance, marketing, HR, operations, supply chain, healthcare, education, and project management.
Career opportunities include:
Data Analyst
Business Analyst
MIS Executive
Reporting Analyst
Financial Analyst
Operations Executive
Sales Analyst
Business Intelligence Executive
For example, a sales executive with advanced Excel knowledge can create automated reports, analyze customer trends, and present business insights more effectively.
Following a structured roadmap helps learners master Excel more efficiently.
Learn Excel fundamentals.
Practice formulas and functions.
Master data formatting and validation.
Learn lookup functions.
Create PivotTables and Pivot Charts.
Build interactive dashboards.
Learn Data Analysis Using Excel.
Understand business reporting techniques.
Work on real business datasets.
Complete practical analytics projects.
Earn an Excel Course with Certificate to validate your skills.
Learning Excel provides several long-term career advantages.
High Workplace Demand: Excel is used in almost every industry.
Improved Productivity: Automation and formulas reduce manual work.
Better Decision-Making: Data visualization helps identify trends quickly.
Career Flexibility: Excel skills apply across finance, HR, marketing, logistics, healthcare, and operations.
Business Intelligence Foundation: Excel prepares learners for Power BI and advanced analytics tools.
Professional Growth: Strong Excel skills improve job performance and promotion opportunities.
Practical Business Skills: Learners gain confidence handling real-world business data.
Learning formulas without applying them limits practical understanding.
Solution: Practice with real business datasets.
Many learners underestimate the power of PivotTables.
Solution: Use PivotTables regularly to summarize and analyze data efficiently.
Overly complicated worksheets reduce usability.
Solution: Keep reports clean, organized, and easy to understand.
Employers value visual reporting skills.
Solution: Learn to create interactive dashboards using charts, slicers, and PivotTables.
Theory alone is not enough.
Solution: Build business reports, sales dashboards, financial summaries, and KPI trackers using Excel.
Excel continues to evolve from a spreadsheet application into a powerful business analytics tool. Organizations now use Excel alongside Power BI, AI-powered features, Power Query, and cloud-based collaboration to analyze business data, automate reporting, and make faster decisions.
According to the Microsoft Work Trend Index 2024, 75% of knowledge workers now use AI at work, demonstrating how modern productivity tools—including Microsoft Excel with AI-powered capabilities—are transforming the way professionals analyze data, generate insights, and improve business efficiency. This growing adoption is increasing the demand for professionals who can combine Excel expertise with business analytics skills.
Some of the biggest Excel and business analytics trends in 2026 include:
AI-assisted data analysis in Excel
Power Query for automated data transformation
Interactive dashboard development
Excel integration with Power BI
Cloud-based collaboration using Microsoft 365
Business forecasting using advanced Excel functions
Self-service business intelligence
Automated reporting and data visualization
At Well Spring Talent Solutions, learners gain practical exposure to these modern business analytics techniques through industry-oriented training, live projects, business case studies, and expert mentorship, helping them build workplace-ready skills.
Developing strong Excel skills requires consistent practice and real-world application. Here are some practical recommendations:
Master Excel formulas before learning advanced analytics features.
Practice PivotTables and Pivot Charts using business datasets.
Learn lookup functions such as XLOOKUP, INDEX-MATCH, and VLOOKUP.
Build dashboards that summarize business performance clearly.
Learn Power Query to automate repetitive data preparation tasks.
Analyze publicly available datasets to improve practical skills.
Practice presenting insights through charts, KPIs, and executive reports.
Choosing the right training institute plays an important role in building practical Excel and business analytics skills.
Well Spring Talent Solutions helps learners become industry-ready through:
Industry-oriented Excel for Data Analytics Course
Comprehensive Advanced Excel Course
Practical Microsoft Excel Training
Hands-on business reporting projects
Dashboard development using real datasets
Excel for Business Analytics training
Internship opportunities for practical exposure
Guidance from experienced industry mentors
Resume building and interview preparation
Excel Course with Certificate
Career guidance and placement assistance
This practical learning approach enables learners to confidently use Excel for reporting, dashboard development, business analysis, and decision-making across industries.
|
Traditional Learning |
Industry-Oriented Training |
|
Focuses mainly on spreadsheet basics |
Covers advanced Excel for business analytics |
|
Formula practice only |
Real business reporting projects |
|
Basic chart creation |
Interactive dashboards and KPIs |
|
Sample classroom exercises |
Live business case studies |
|
Limited career guidance |
Resume building and interview preparation |
|
Certificate-focused |
Job-ready analytical skills with practical exposure |
Here are five expert recommendations for mastering Excel:
Build a strong foundation in formulas before learning dashboards and automation.
Practice with real business datasets rather than sample spreadsheets.
Learn Power Query because it significantly improves productivity.
Focus on data visualization to communicate insights effectively.
Combine Excel with Power BI and SQL to expand your career opportunities in analytics.
Is an Excel for Data Analytics Course suitable for beginners?
Yes. An Excel for Data Analytics Course is designed for beginners as well as working professionals. It starts with Excel fundamentals before progressing to advanced formulas, PivotTables, dashboards, Power Query, and business reporting through practical exercises.
Is Advanced Excel still worth learning in 2026?
Absolutely. Despite the growth of modern BI tools, Advanced Excel remains one of the most widely used applications across finance, HR, sales, operations, marketing, and business analytics. It continues to be a highly valued workplace skill.
What jobs can I get after learning Advanced Excel?
Completing an Advanced Excel Course can prepare you for roles such as MIS Executive, Data Analyst, Business Analyst, Reporting Analyst, Financial Analyst, Operations Executive, Sales Analyst, and Business Intelligence Executive.
Do I need programming knowledge to learn Excel for data analytics?
No. Programming knowledge is not required. Learners typically begin with Excel formulas, PivotTables, dashboards, and Power Query before moving to advanced analytics tools like Power BI or Python if required.
Which certification should I pursue after Excel training?
An Excel Course with Certificate is an excellent starting point. After mastering Excel, learners can continue with certifications in Power BI, SQL, Data Analytics, or Business Intelligence to expand their career opportunities.
What is an Excel for Data Analytics Course?
It is a professional training program that teaches learners how to analyze, visualize, and interpret business data using Microsoft Excel through advanced formulas, PivotTables, dashboards, and reporting techniques.
Why is Excel important for business analytics?
Excel helps organizations organize, analyze, and visualize business data, enabling faster decision-making and improved operational efficiency.
Who should learn Advanced Excel?
Students, fresh graduates, accountants, business analysts, HR professionals, finance executives, marketing professionals, entrepreneurs, and office administrators can all benefit from Advanced Excel skills.
How does Excel training improve career opportunities?
Excel training develops analytical thinking, improves reporting skills, prepares learners for business analytics roles, and increases employability across multiple industries.
Is Excel worth learning in 2026?
Yes. Excel remains one of the most widely used business productivity and analytics tools worldwide. Combined with Power BI and AI-powered features, it continues to be an essential skill for professionals.
Excel remains a core business analytics tool.
Advanced formulas and PivotTables improve productivity.
Dashboards help communicate business insights effectively.
Practical projects strengthen analytical skills.
Excel integrates seamlessly with Power BI and modern BI platforms.
Industry-oriented training improves job readiness.
Microsoft Excel continues to be one of the most valuable tools for business reporting, financial analysis, and data-driven decision-making. Whether you are beginning your career or looking to enhance your professional skills, mastering Excel provides a strong foundation for business analytics and future technologies.
Choosing the right Excel for Data Analytics Course is about more than learning formulas—it is about developing analytical thinking, solving business problems, and creating meaningful insights from data. Through industry-oriented training, practical projects, business case studies, expert mentorship, certificate preparation, and career guidance, Well Spring Talent Solutions helps learners build the confidence and expertise needed to succeed in today's data-driven workplace.
15 Oct 2026
15 Oct 2026

14 Oct 2026
14 Oct 2026
13 Oct 2026
Beginners should start with an Excel Course with Certificate that covers formulas, functions, PivotTables, dashboards, and business reporting. Once comfortable with Excel, they can continue with Power BI, SQL, or Data Analytics certifications.
Yes. Excel is suitable for learners from all academic backgrounds, including commerce, management, science, arts, and engineering. It focuses on business reporting, analysis, and problem-solving rather than programming.
A quality Excel for Data Analytics Course includes real-world datasets, dashboard development, business reporting, KPI tracking, financial analysis, and case studies. Practical projects help learners gain confidence and improve interview performance.
Excel is ideal for data analysis, calculations, and spreadsheet-based reporting, while Power BI is designed for advanced business intelligence, interactive dashboards, and large-scale data visualization. Many organizations use both tools together for comprehensive analytics.
Look for an institute that offers an updated curriculum, experienced trainers, practical projects, business case studies, certification support, career guidance, interview preparation, and placement assistance. Hands-on, industry-oriented training provides the strongest foundation for professional success.
Get internship updates, IT training news, placement opportunities, and career tips directly to your inbox.
Join our WhatsApp community for internship updates, IT courses, placement support, and latest job opportunities.
Join Now